A Simple Explanation of Information Gain and Entropy
What Information Gain and Information Entropy are and how they're used to train Decision Trees.
| UPDATED
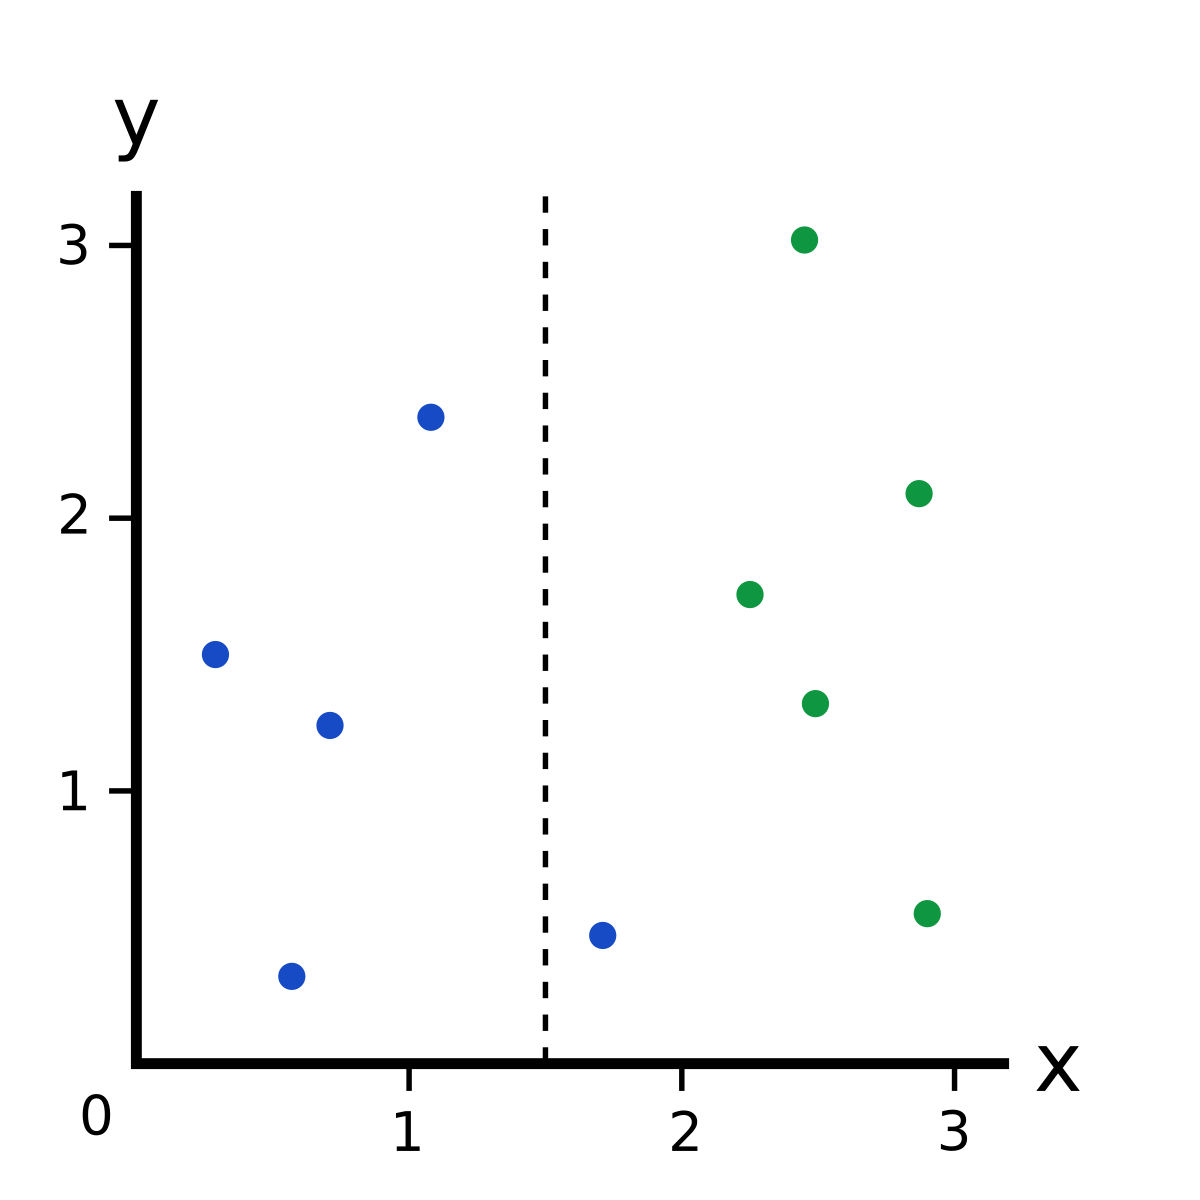
Information Gain, like Gini Impurity, is a metric used to train Decision Trees. Specifically, these metrics measure the quality of a split. For example, say we have the following data:

What if we made a split at ?

This imperfect split breaks our dataset into these branches:
- Left branch, with 4 blues.
- Right branch, with 1 blue and 5 greens.
It’s clear this split isn’t optimal, but how good is it? How can we quantify the quality of a split?
That’s where Information Gain comes in.
Confused? Not sure what Decision Trees are or how they’re trained? Read the beginning of my introduction to Random Forests and Decision Trees.
Note: this post looks better in Light Mode. If you’re in Dark Mode, scroll up and use the toggle in the top right to switch!
Information Entropy
Before we get to Information Gain, we have to first talk about Information Entropy. In the context of training Decision Trees, Entropy can be roughly thought of as how much variance the data has. For example:
- A dataset of only blues would have very low (in fact, zero) entropy.
- A dataset of mixed blues, greens, and reds would have relatively high entropy.
Here’s how we calculate Information Entropy for a dataset with classes:
where is the probability of randomly picking an element of class (i.e. the proportion of the dataset made up of class ).
The easiest way to understand this is with an example. Consider a dataset with 1 blue, 2 greens, and 3 reds: . Then
We know because of the dataset is blue. Similarly, (greens) and (reds). Thus,
What about a dataset of all one color? Consider 3 blues as an example: . The entropy would be
Information Gain
It’s finally time to answer the question we posed earlier: how can we quantify the quality of a split?
Let’s consider this split again:
Before the split, we had 5 blues and 5 greens, so the entropy was
After the split, we have two branches.
Left Branch has 4 blues, so because it’s a dataset of all one color.
Right Branch has 1 blue and 5 greens, so
Now that we have the entropies for both branches, we can determine the quality of the split by weighting the entropy of each branch by how many elements it has. Since Left Branch has 4 elements and Right Branch has 6, we weight them by and , respectively:
We started with entropy before the split and now are down to ! Information Gain = how much Entropy we removed, so
This makes sense: higher Information Gain = more Entropy removed, which is what we want. In the perfect case, each branch would contain only one color after the split, which would be zero entropy!
Recap
Information Entropy can be thought of as how unpredictable a dataset is.
- A set of only one class (say, blue ) is extremely predictable: anything in it is blue. This would have low entropy.
- A set of many mixed classes is unpredictable: a given element could be any color! This would have high entropy.
The actual formula for calculating Information Entropy is:
Information Gain is calculated for a split by subtracting the weighted entropies of each branch from the original entropy. When training a Decision Tree using these metrics, the best split is chosen by maximizing Information Gain.
Want to learn more? Check out my explanation of Gini Impurity, a similar metric, or my in-depth guide Random Forests for Complete Beginners.